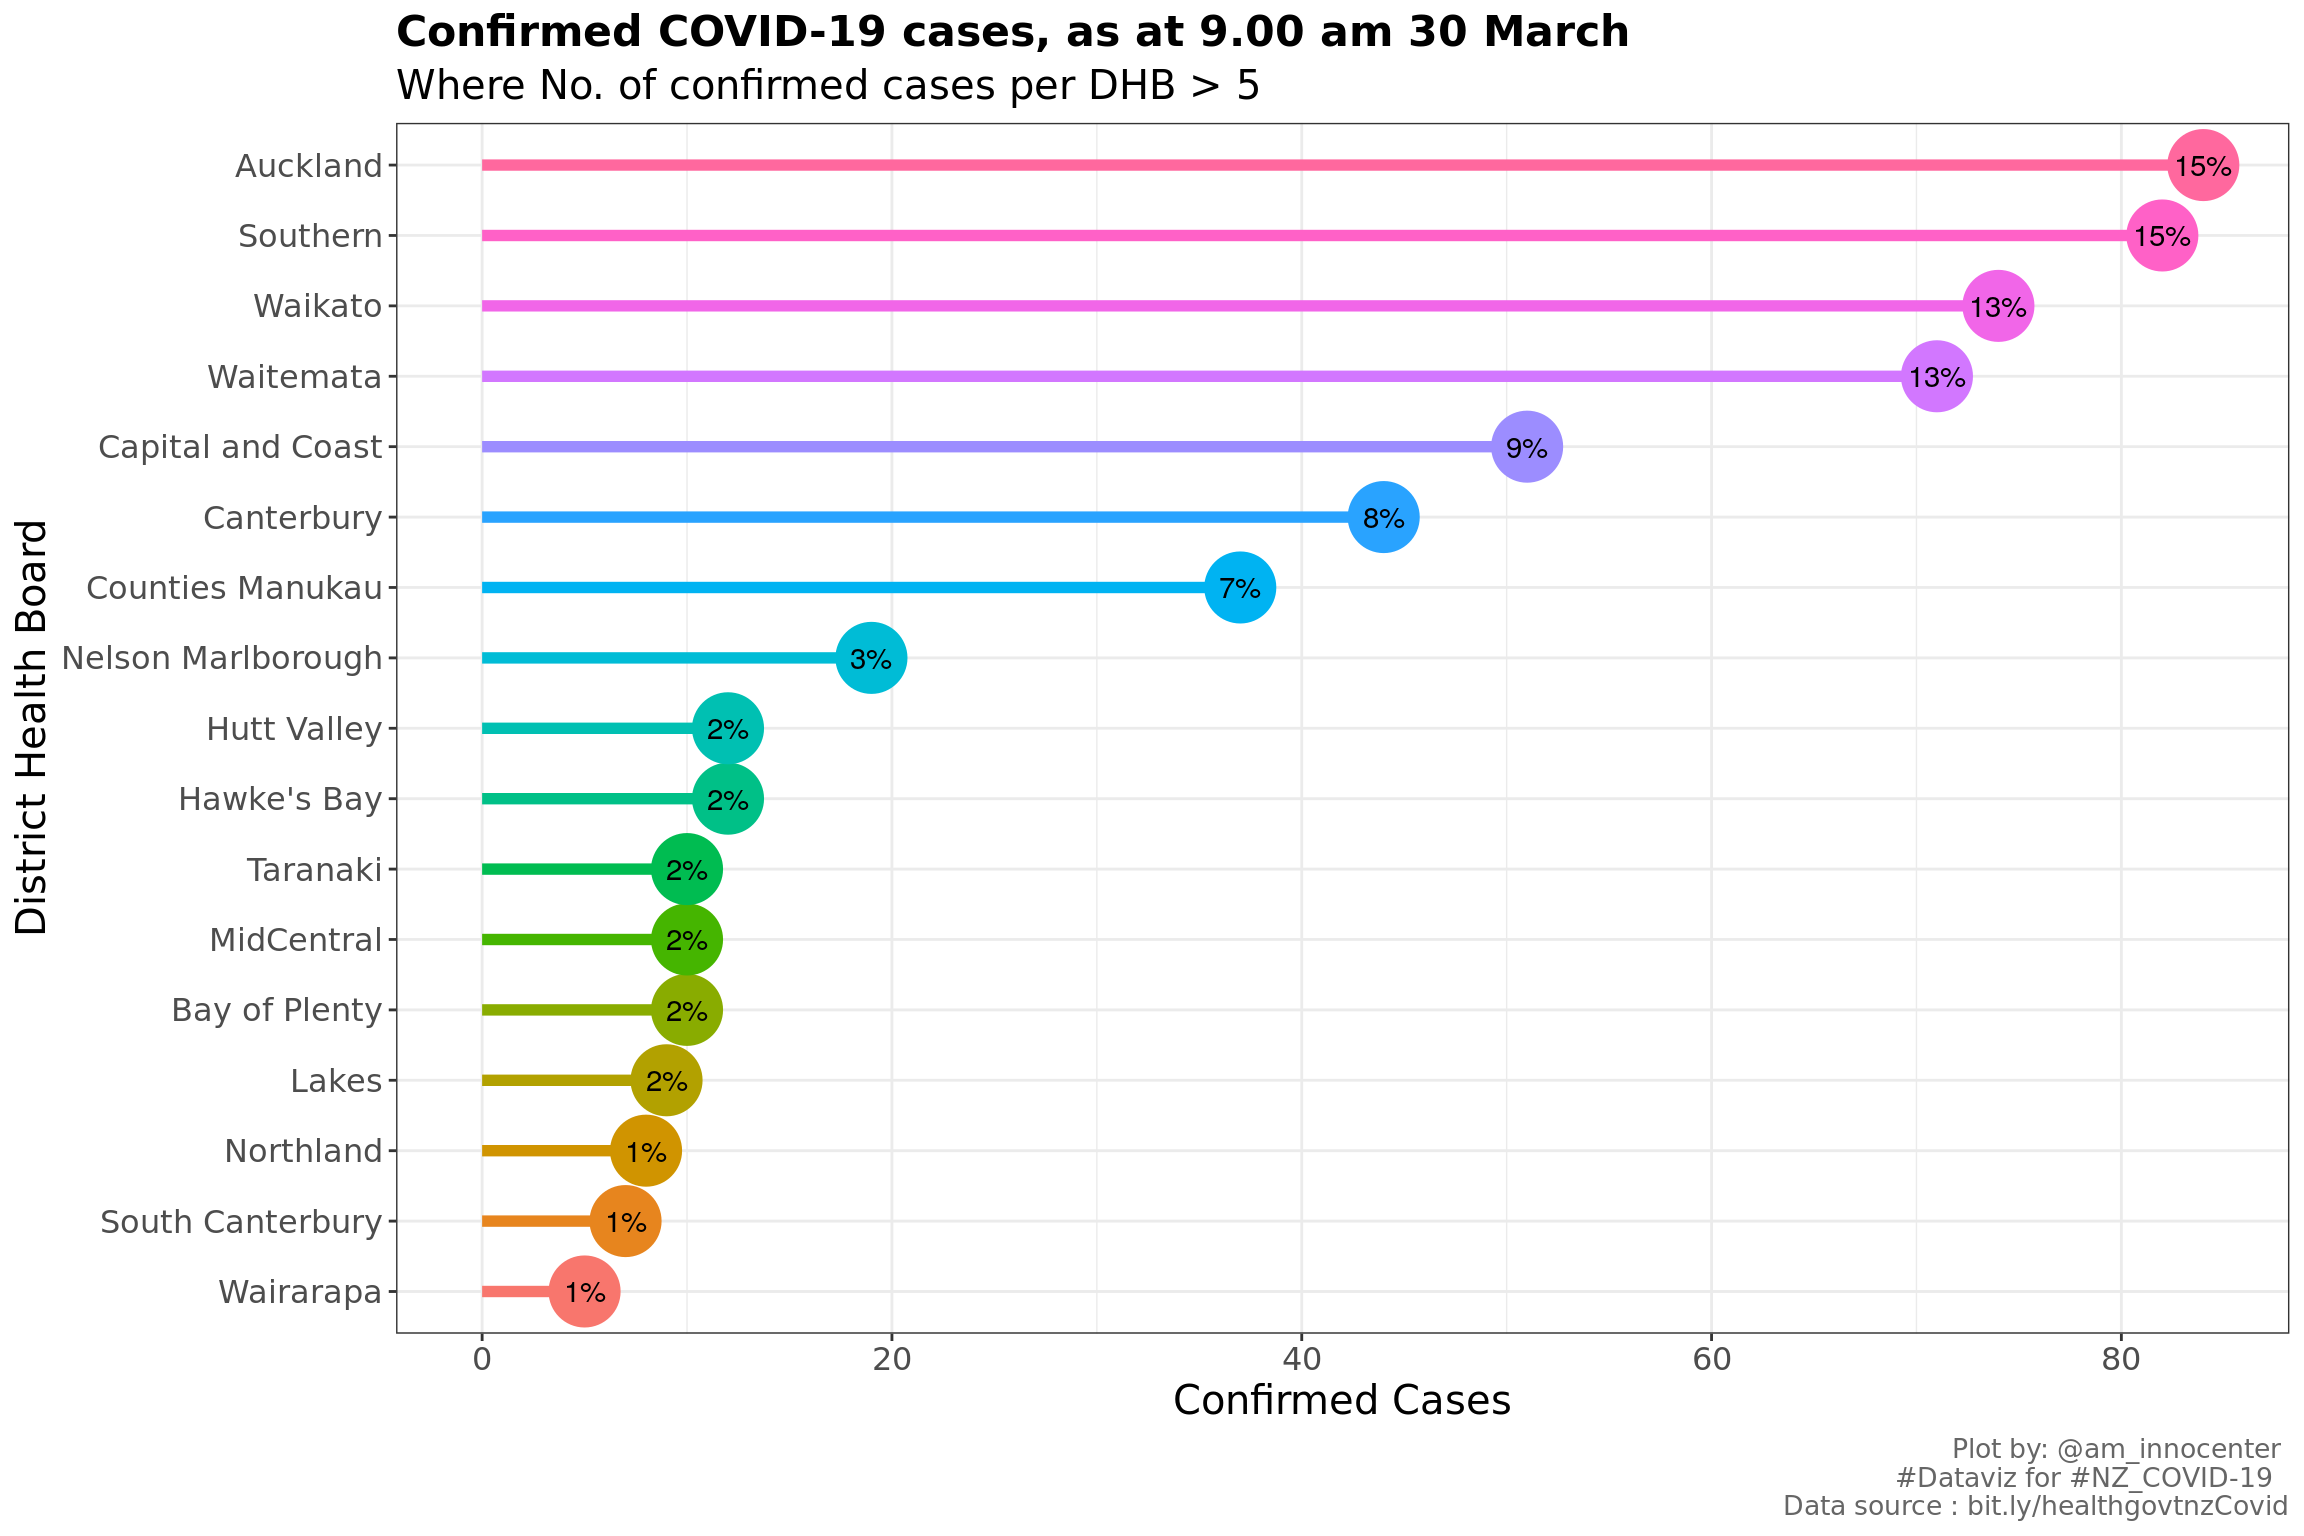
The objective is to provide insights based on the information from the New Zealand (NZ) Ministry of Health. Here is the link for obtaining the COVID-19 cases. Will look at the exploring the confirmed cases per District Health Board - commonly known as DHB, gender and age group.
With time I might automate the data visualisation - the tricky bit is that the table format and HTML texts/labels keep changing every time.
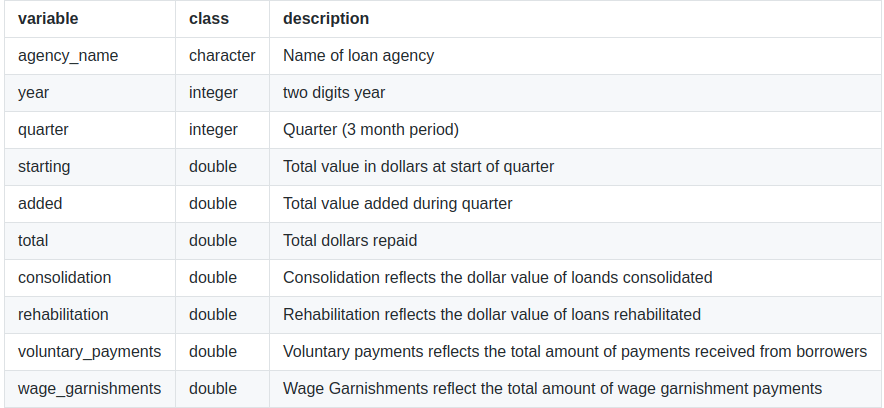
This week the data was inspired from the Dignity & Debt project. This will help in understanding and spreading awareness around Student Loan debt. The data source is here
The objective for this is to perform data visualization and determine the most preferred method of payment for student loans in the US. I will use patchwork package to combine plots.
Loading the data
loans <- read.csv("https://raw.githubusercontent.com/rfordatascience/tidytuesday/master/data/2019/2019-11-26/loans.csv") glimpse(loans) ## Observations: 291 ## Variables: 10 ## $ agency_name <fct> "Account Control Technology, Inc.
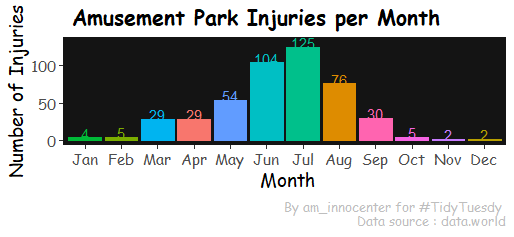
Amusement park injuries data is from data.world. This is part of the weekly #TidyTuesday project aimed at the R ecosystem on Twitter.
The data has a lot of text, inconsistent NAs and dates.
Objectives Clean the data Perform EDA and Data viz To achieve the objectives we shall answer the following questions
How many injuries were recorded per year, per month? What kind of injuries were reported? What were the top causes of injuries?
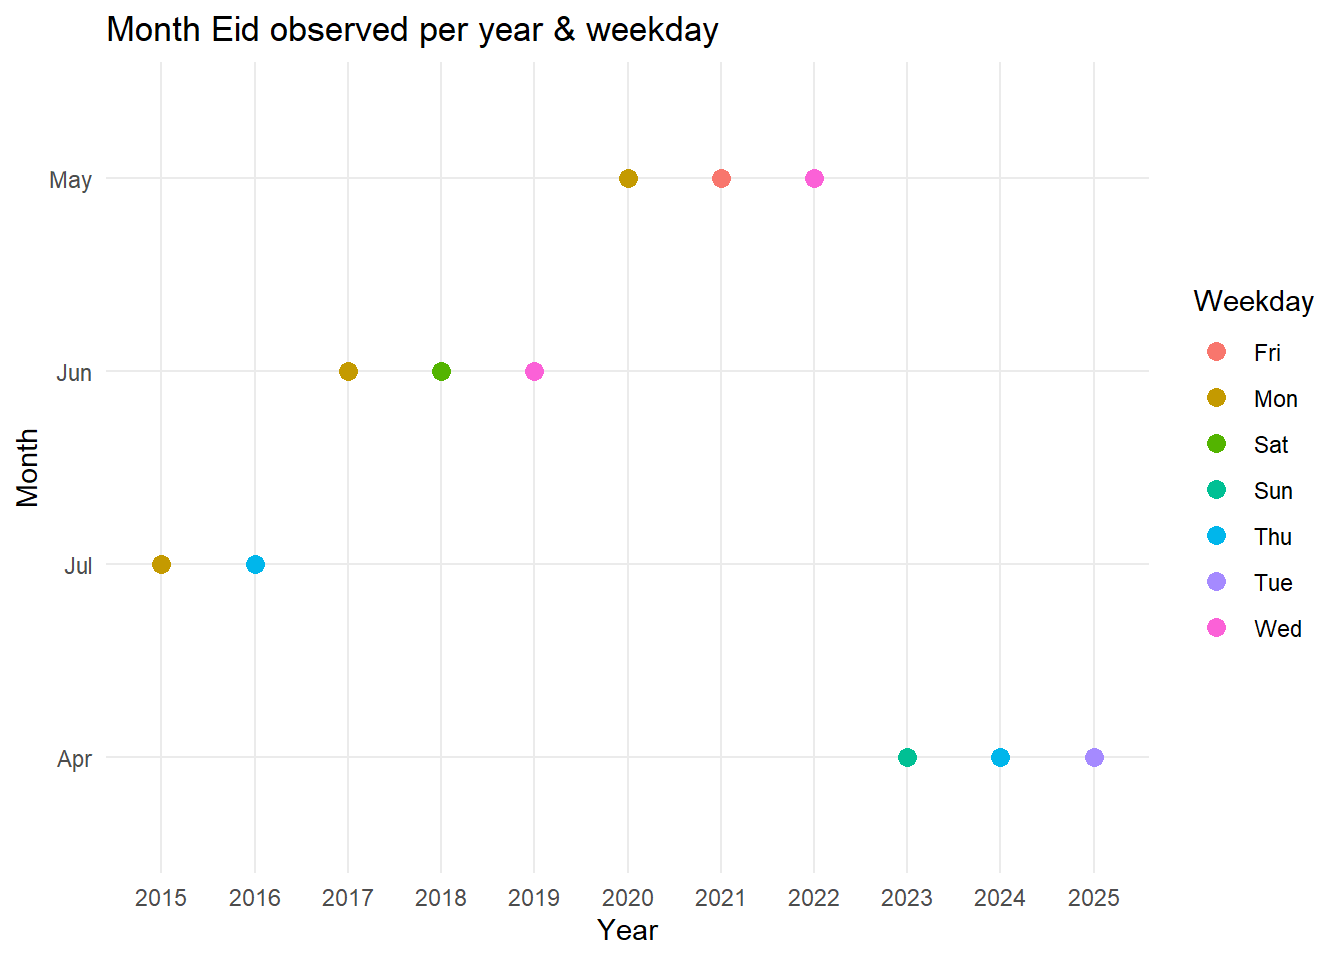
Finally, Eid is here! Id-Ul-Fitr commonly known as Eid marks the end of fasting (Ramadhan) and is the first day of the Islamic month Shawwal. I spent my weekend learning data mining with rvest and analysing data for Eid observations.
The following link contains information about Eid, its occurence of per Day, Month, year. For today, I intend to only mine the table and explore.
Objectives Mine data - table - from a URL using the package rvest (this was my first time and its really simple)