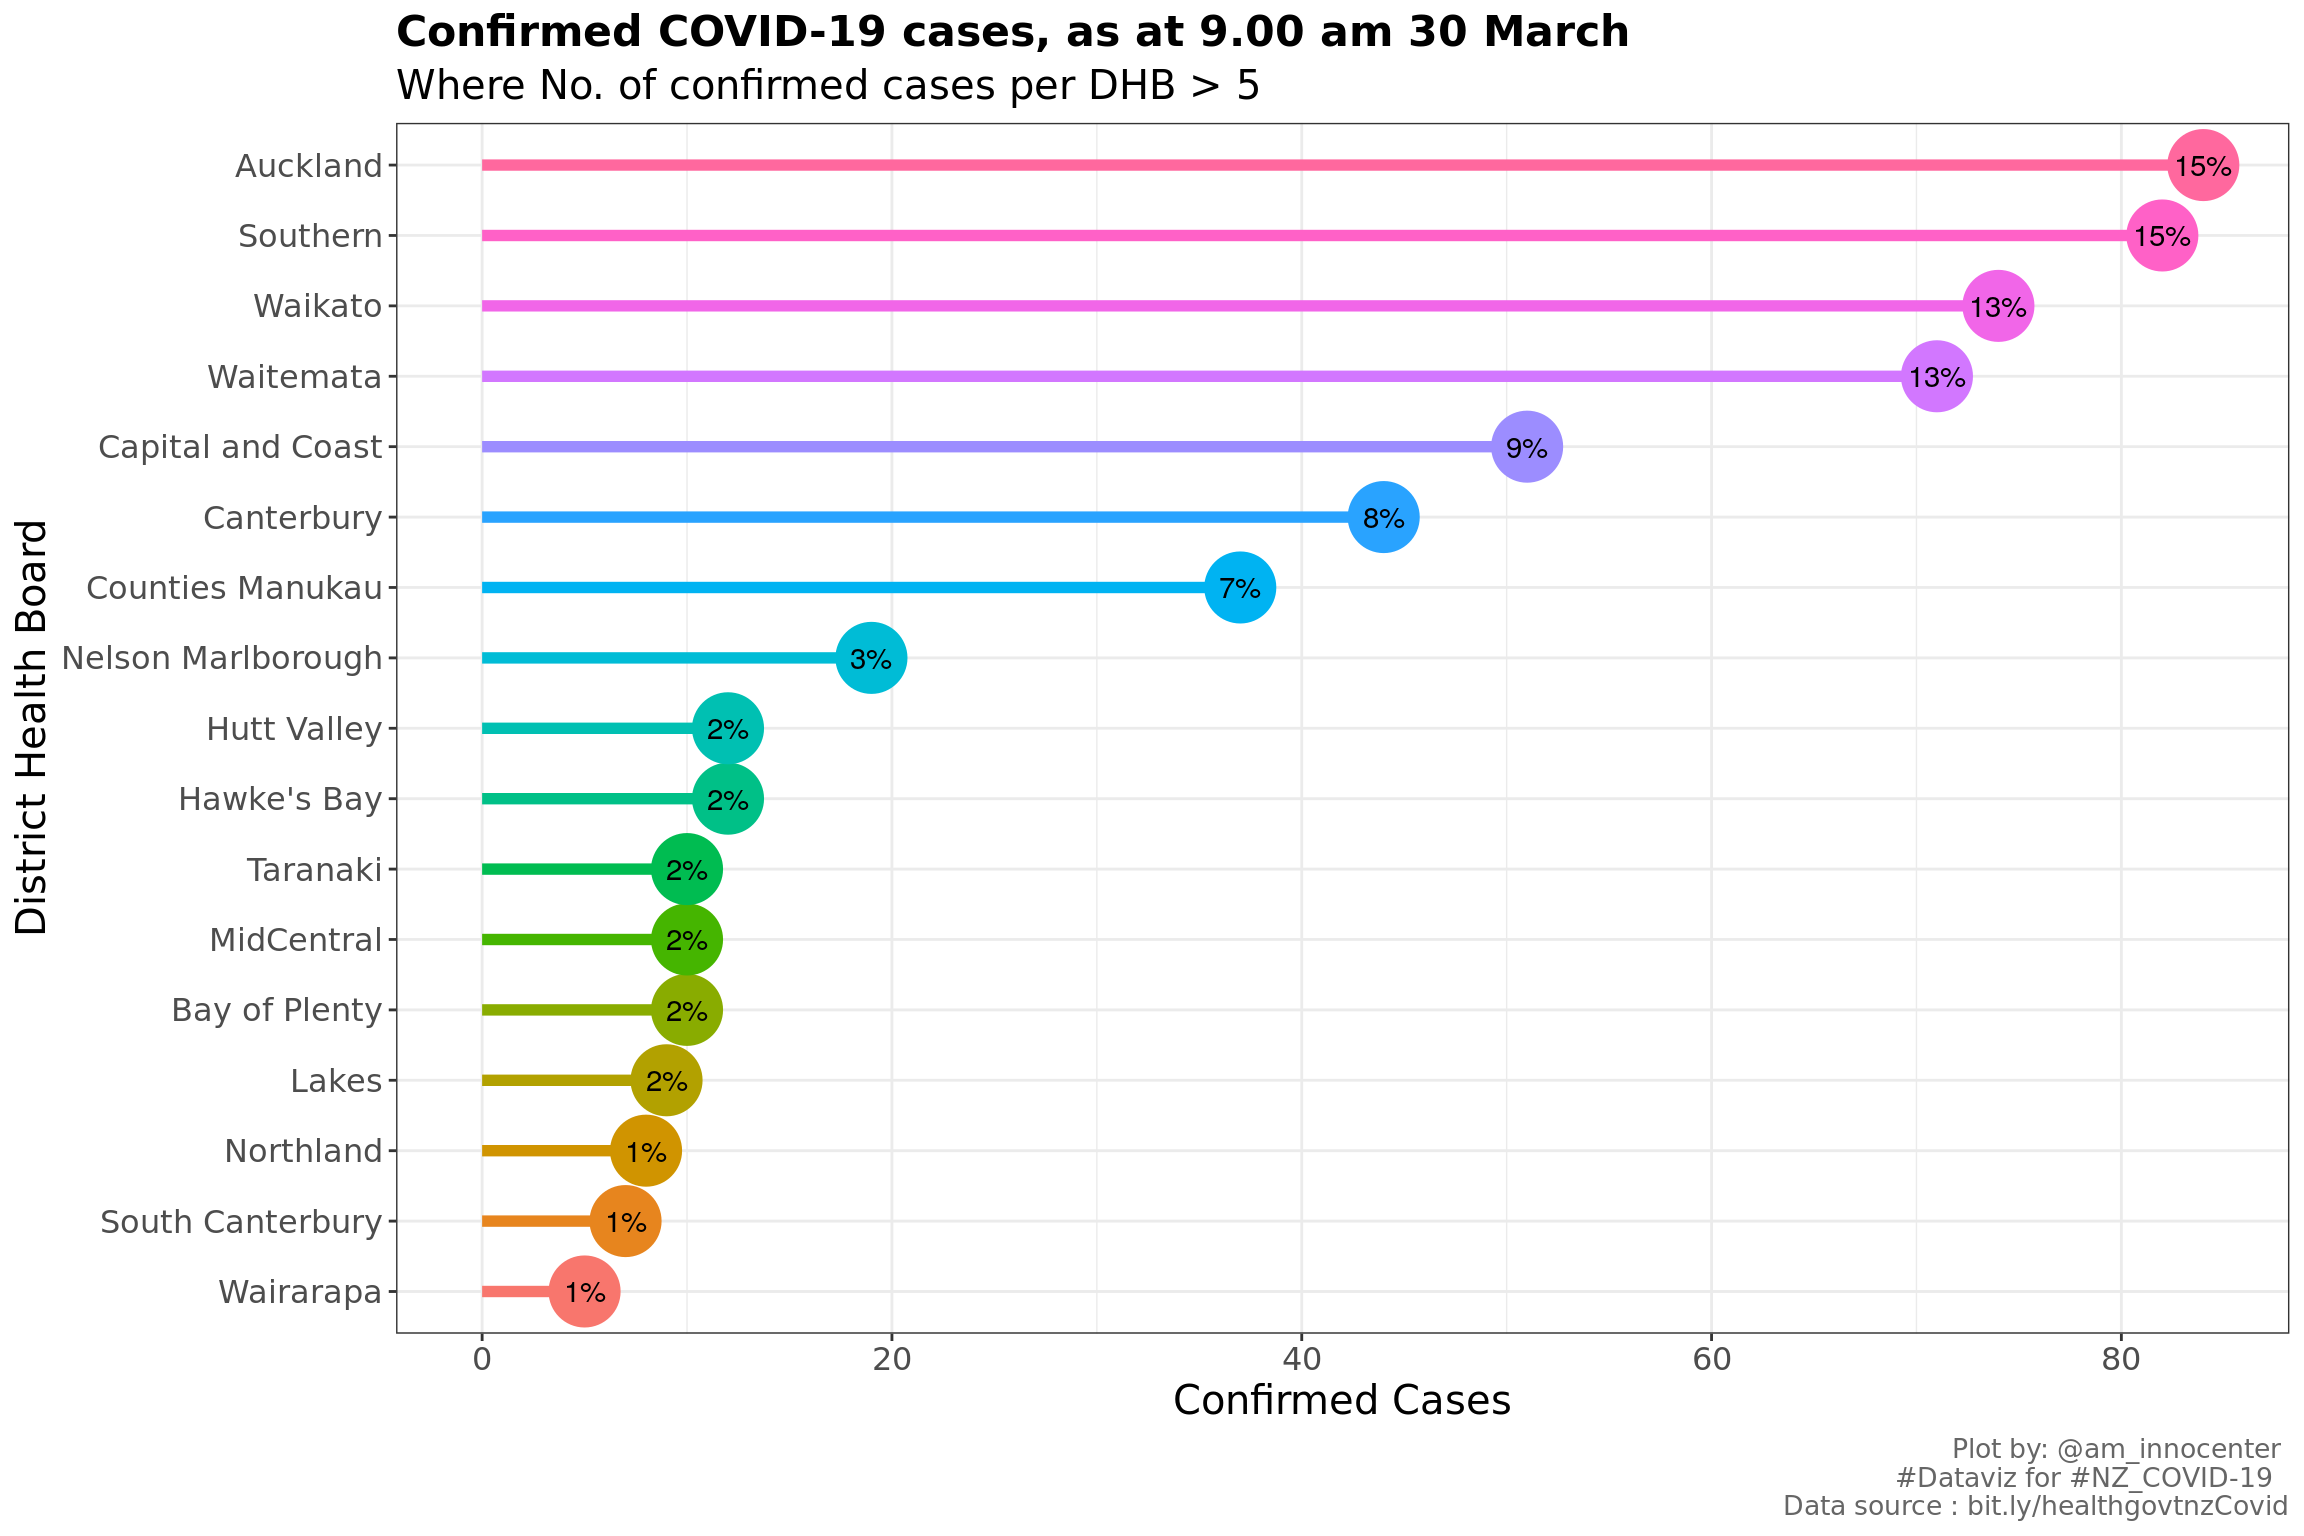
The objective is to provide insights based on the information from the New Zealand (NZ) Ministry of Health. Here is the link for obtaining the COVID-19 cases. Will look at the exploring the confirmed cases per District Health Board - commonly known as DHB, gender and age group.
With time I might automate the data visualisation - the tricky bit is that the table format and HTML texts/labels keep changing every time.
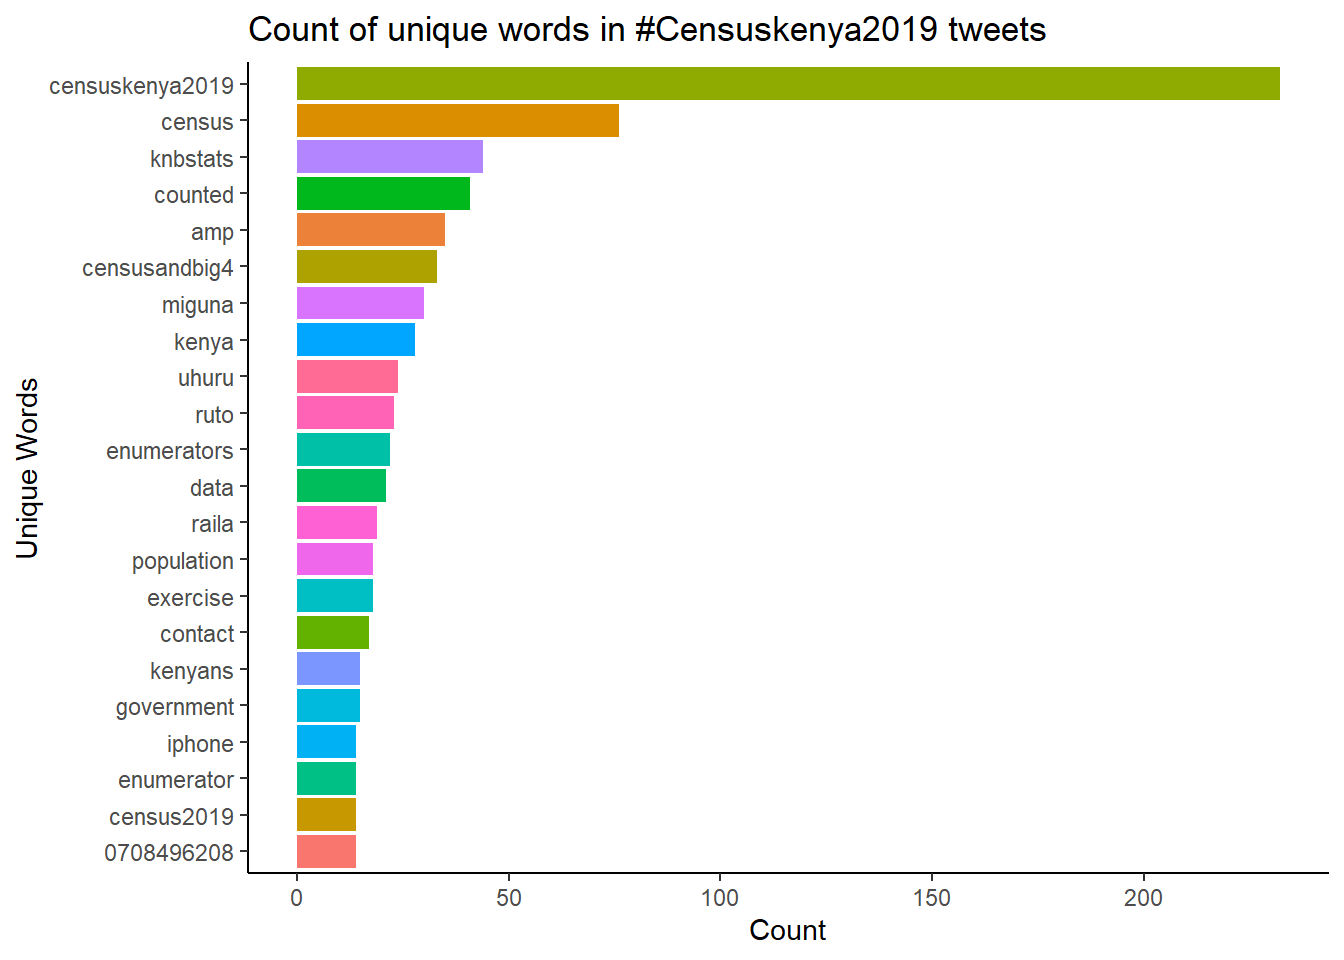
Census 2019 in Kenya The 8th 2019 Population and Housing Census started from the night of 24/25th August 2019 and ended on 31st August 2019.
Census involved counting of people within the border of Kenya at a specific time. Census is an important process for the Govenrment as it provides evidence for proper planning and resource allocation, policy formulation and targeting of development plans. You can read more about the census here and here
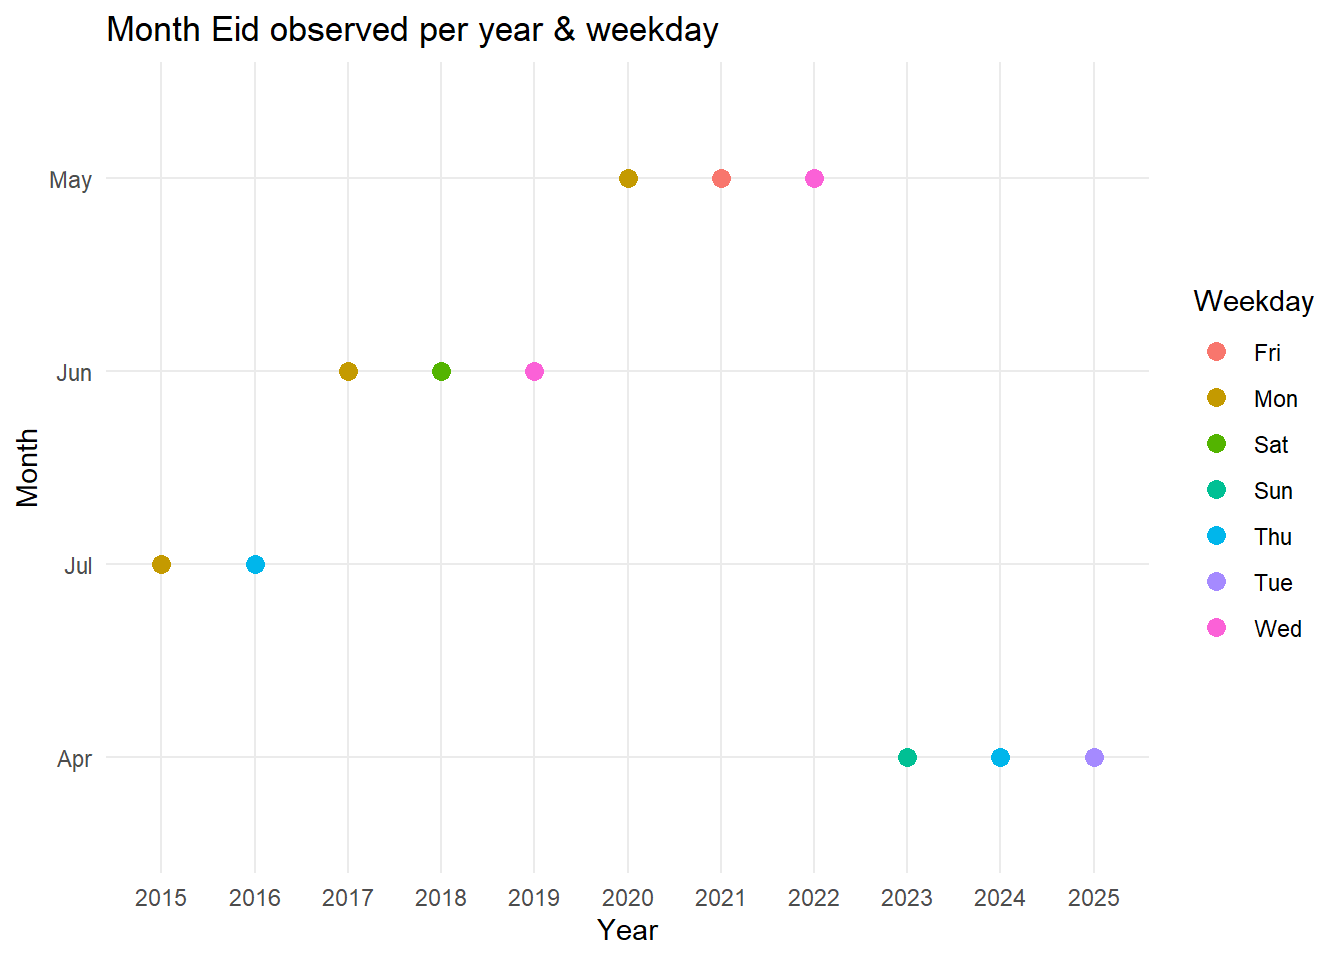
Finally, Eid is here! Id-Ul-Fitr commonly known as Eid marks the end of fasting (Ramadhan) and is the first day of the Islamic month Shawwal. I spent my weekend learning data mining with rvest and analysing data for Eid observations.
The following link contains information about Eid, its occurence of per Day, Month, year. For today, I intend to only mine the table and explore.
Objectives Mine data - table - from a URL using the package rvest (this was my first time and its really simple)